Lesson 7: Multiple Regression and Polynomial Regression
In the previous lessons, we looked at a simple one-dimensional example of a Linear Regression algorithm: one number for the x independent variable and one number for the y result. But in real life, that result may depend on multiple parameters.
Linear Regression algorithm is a good fit in that case, too. It's called "multiple linear regression" or "multivariant linear regression", then.
The Data
For example, instead of this 2-column CSV file:
years_of_experience salary 5 3150 9 3787 4 2991 10 4551 8 3540You have three columns:
years_of_experience city salary 5 1 3150 9 1 3787 4 2 2991 10 1 4551 8 2 3540We have data from two cities (numbered 1 and 2), and our goal is to predict the salary for two features/parameters: years of experience and city.
You can view/download that CSV here.
The Code
The code for this is almost identical to the singular linear regression, so I will not comment on it much. Let it be a repeating exercise for you.
main.py
import pandas as pdimport numpy as npfrom sklearn.model_selection import train_test_splitfrom sklearn.linear_model import LinearRegression df = pd.read_csv("salaries-cities.csv") x = df.iloc[:,:-1].values # Taking all columns except the last one, i.e. TWO columnsy = df.iloc[:,-1].values x_train,x_test,y_train,y_test = train_test_split(x,y,test_size=0.2,random_state=0) model = LinearRegression() model.fit(x_train, y_train) y_pred = model.predict(x_test)print(y_pred)main.py
# Result:[2668.45116176 3603.83572806 2855.52807502 3603.83572806 3714.30946547 2778.92489916 4275.54020525 3042.60498828 3416.7588148 3153.07872568 2294.29733523 3416.7588148 3042.60498828 3416.7588148 3229.68190154 3416.7588148 3603.83572806 2778.92489916 3042.60498828 2966.00181242]So, we have the 20 prediction values, now the accuracy with the R2 score?
main.py
# ...from sklearn.metrics import r2_score # ... print(y_pred) r2 = r2_score(y_test, y_pred) print(f"R2 Score: {r2} ({r2:.2%})")main.py
# Result:R2 Score: 0.9069837682066595 (90.70%)Great, 90.70% accuracy is excellent!
And now, the most interesting part: we can predict the salary based on years and city, like this:
main.py
# ... print(f"R2 Score: {r2} ({r2:.2%})") salaries = model.predict([[11, 1], [11, 2], [12, 1], [12, 2]])print(salaries)main.py
# Result:[4462.61711851 4165.06646785 4649.69403177 4352.14338111]From here, you can see that city no.1 brings a bit higher salaries than city no.2. A clearly linear dependency.
If you want to see that dependency visually, it's possible when having two independent variables in x, then we have a 3-D graph. But the code for it with matplotlib is quite complex and not suitable for the beginner level. You may read this tutorial to learn it.
Mathematical Explanation
As we saw in the previous lesson, simple Linear Regression can be described with this equation:
main.py
Y = a + b * XFor multiple Linear Regression, the formula is the same but with just more variables.
main.py
Y = a + b1 * X1 + b2 * X2 + b3 * X3 + ...In other words, we have more independent variables and their coefficients, that's it.
Polynomial Regression
Another regression algorithm is polynomial, which is suitable when the data isn't linear, and its graph looks like a curve:
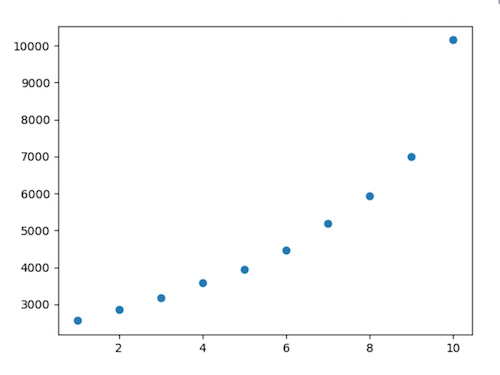
Python code still uses the Linear Regression model for this but transforms the features to fit the polynomial formula.
Mathematically speaking, the equation is this:
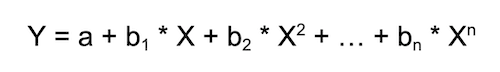
As you can see, there are multiple coefficients, and X is multiplied, then squared, then cubed, and so on.
For the purpose of this course, I've decided not to explain it in detail because I haven't found many practical job offers specifically targeting polynomial regression. I want to target the real ML jobs so you would get the most beneficial value from this course.
If you want to learn more about polynomial regression, I recommend these tutorials:
- Medium: Polynomial Regression in Python
- W3Schools: Machine Learning - Polynomial Regression
- YouTube: Polynomial Regression in Python
Next, we will go to the second project example of this course - a more complex one that needs data pre-processing.
Final File
If you felt lost in the code above, here's the final file with all the code from this lesson:
main.py
import pandas as pdimport numpy as npfrom sklearn.model_selection import train_test_splitfrom sklearn.linear_model import LinearRegressionfrom sklearn.metrics import r2_score df = pd.read_csv("salaries-cities.csv") x = df.iloc[:,:-1].values # Taking all columns except the last one, i.e. TWO columnsy = df.iloc[:,-1].values x_train,x_test,y_train,y_test = train_test_split(x,y,test_size=0.2,random_state=0) model = LinearRegression() model.fit(x_train, y_train) y_pred = model.predict(x_test) r2 = r2_score(y_test, y_pred)print(f"R2 Score: {r2} ({r2:.2%})") salaries = model.predict([[11, 1], [11, 2], [12, 1], [12, 2]])print(salaries)- Intro
- Example 1: More Simple
- Example 2: More Complex
I got this warning
Feature "names": maybe you don't have the column names as the first row in your CSV?
https://stackoverflow.com/questions/69326639/sklearn-warning-valid-feature-names-in-version-1-0
check the link https://ibb.co/TKMbs1s
In the lines 9 and 10 Povilas forgot to put .values to convert X and Y to array.
Hope this will be helpful.
Of course! How could I miss the
.values, you're totally right. And how did it work without.valuesin the first place, when writing this tutorial... Mystic.Anyway, fixed in the lesson, thanks!