Lesson 2: Install Python Libraries and Read CSV Data
Welcome to this ML project showcasing a Linear Regression algorithm with Python and Scikit-learn library.
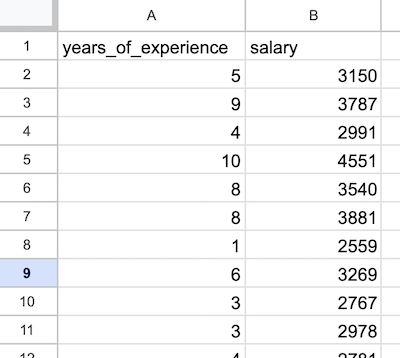
Our "mission" here is to predict employee salaries based on the years of experience. As a starter point, we have this CSV file of 100 rows:
You can view/download that CSV here.
Notice: if you want to quickly generate a similar CSV file for testing with Python, we have a quick tutorial about it.
The goal is to train the model to predict the salary with any given parameter of years of experience.
Let's go through it, step-by-step.
Step 0. Tools and Prerequisites
During this course, we will write a Python script to build the ML model. So, you need to have Python installed on your computer.
Also, you need to have some IDE to write code in: something like PyCharm (Community Edition is free).
You may also write code in a tool called Jupyter Notebook, which is often the choice of ML engineers (and I have a separate tutorial about the benefits of Jupyter Notebook), but in this course, we didn't want to overwhelm you with tools, so we'll stick with PyCharm and cover Jupyter in the future courses.
That's about it. We will also install a few Python libraries, but we'll do it along the way.
Step 1. Importing Libraries
For our project, we need to import three well-known Python libraries (also sometimes called "modules"):
- Pandas for reading the CSV into so-called "DataFrames"
- NumPy for dealing with specific array operations
- Matplotlib for a visual view of the data
main.py
import pandas as pdimport numpy as npimport matplotlib.pyplot as pltThose as pd, as np, and as plt are aliases/shortcuts of the library names we will use below to call their methods in a shorter way, like pd.read_csv() instead of writing pandas.read_csv().
Why these libraries? pandas and numpy libraries are typically used in all ML projects, so you can always import them without thinking.
With matplotlib, it's a personal preference, as there are alternatives for drawing the charts, but matplotlib is probably the most popular.
Also, notice that you may import and alias not the full library but a specific part of it, like matplotlib.pyplot instead of the full matplotlib, so we will be writing plt.scatter() instead of matplotlib.pyplot.scatter().
Finally, to make the imports work, you need to make sure that those libraries are installed on your machine. If you haven't done those steps, refer to the documentation of each library, but generally, Python 3 syntax with pip is this:
pip3 install pandaspip3 install numpypip3 install matplotlibWe will also use another library called scikit-learn for the linear regression itself, but we will import it later, at the time we actually need it.
Step 2. Reading Data from CSV
We have a local CSV file prepared in the same folder with 100 rows and two columns: Years of Experience and Salary.
You can view/download that CSV here. Also, you can check out the Jupyter Notebook for this example, here.
We read the contents of that file into a so-called "DataFrame", shortened to df. For that, we use the method from pandas library called read_csv().
Then, that df has many methods to view/transform the data. For example, we can call df.head() to view the first five rows of the CSV just to check if it was read successfully.
main.py
import pandas as pdimport numpy as npimport matplotlib.pyplot as plt df = pd.read_csv("salaries.csv")print(df.head())If we run this code, we will see the following output:
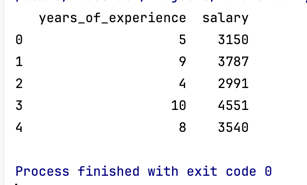
Ok, so we have the data in our DataFrame.
At this stage of an ML project, it's usually time to preprocess the data and check for empty/incorrect/extraordinary values.
But I deliberately simplified this first example so that you would understand the main idea better.
So, in our case, our CSV file is suitable to process right away, and we don't need to filter/change anything in it. We will talk about preprocessing in much more detail in the second example project, later in the course.
Next, let's split the data into inputs/outputs and try to visualize it, in order to understand it better.
- Intro
- Example 1: More Simple
- Example 2: More Complex
No comments or questions yet...