Lesson 3: (In)Dependent Variables and Visualizing Data
In this tutorial, we're solving a problem of predicting the salary (which is the "dependent variable" or sometimes called "target" marked as y) based on the years of experience (which is an "independent variable" or sometimes called "feature" marked as x).
So, we need to split our dataframe into those two.
Split Data Into x and y
For that, we use a dataframe property called iloc[] from the pandas library.
main.py
import pandas as pdimport numpy as npimport matplotlib.pyplot as plt df = pd.read_csv("salaries.csv")print(df.head()) x = df.iloc[:,:-1].values # get all rows with all columns except the last one #y = df.iloc[:,-1].values # get all rows with only the last column #The general syntax of iloc[] is this: df.iloc[row(s), column(s)]. Both rows and columns can be specified with a different syntax, let's look a few examples.
Let's say we have this df variable with 10 rows and 3 columns:
print(df) years_of_experience city salary0 5 1 31501 9 1 37872 4 2 29913 10 1 45514 8 2 35405 8 1 38816 1 1 25597 6 2 32698 3 1 27679 3 1 2978Then we can query different rows/columns like this.
Option 1. Specific row and column.
print(df.iloc[1,2]) # Output:3787This will output the second row and its third column. Remember that enumeration starts with 0 and not 1.
Option 2. Negative row/column.
print(df.iloc[-1,0]) # Output:3Negative values mean counting from the last row/column. So, here we have the last (-1) row and its first column.
Option 3. Range of rows/columns.
print(df.iloc[1:3,0]) # Output:1 92 4Name: years_of_experience, dtype: int64Syntax with a colon: rows from number 1 to number 3, with their first column.
Option 4. All rows/columns with one column/row.
print(df.iloc[:,0]) # Output:0 51 92 43 104 85 86 17 68 39 3Name: years_of_experience, dtype: int64Colon without numbers: get ALL rows, with their first column (colon without numbers acts as "all").
Option 5. All rows/columns with multiple columns/rows.
print(df.iloc[:,0:2]) # Output: years_of_experience city0 5 11 9 12 4 23 10 14 8 25 8 16 1 17 6 28 3 19 3 1Colons for rows/column: get ALL rows, with their first two columns.
As you can see, the iloc[] method allows us to get a specific row or column, or a range of rows/columns from the dataframe.
So, now I will repeat once again what we did in our specific case, and you should understand this syntax better now:
# get all rows with all columns except the last onex = df.iloc[:,:-1].values # get all rows with only the last columny = df.iloc[:,-1].valuesWe can print out the first five elements of each x and y so you would understand it better:
print(x[0:5]) # Result:[[ 5] [ 9] [ 4] [10] [ 8]]print(y[0:5]) # Result:[3150 3787 2991 4551 3540]Notice that the x variable is a two-dimensional array of arrays, and the y variable is a simple one-dimensional array. This is how the linear regression algorithm generally works - the dependent variables should be an array, and each item may contain one or more independent variables.
We will also briefly talk about multiple linear regression in the upcoming lesson separately.
A Few Words About Data Types
An important thing to understand here is the data types we're working with. The df variable is a dataframe from the pandas library, but the result of df.iloc[].values is a different type - so-called ndarray from the numpy library.
So, with the ndarray, we can't run x.head() as we did above with the dataframe. We would get an error in that case: "AttributeError: 'numpy.ndarray' object has no attribute 'head'".
Instead, we need to use the ndarray syntax of slicing items with x[0:5].
So, a pretty important thing in ML projects is working with data and at any given point, understanding what is the type of data you're working with.
To check the type of any object, in Python, you can just run type(variable):
print(type(df))# Output:<class 'pandas.core.frame.DataFrame'> print(type(x))# Output:<class 'numpy.ndarray'>Visualize Data with Matplotlib
The next step is to load the data as a chart, showing the salary dependency on the years of experience. We expect it to be linear, which means - the more years the person works, the more proportionally they earn.
But we need to test our assumption to ensure this is the right algorithm. For that, we will use the matplotlib library to draw the chart and see if there's a visual line to be drawn.
So, we can pass our x and y into the plt.scatter() method to draw the chart.
main.py
import pandas as pdimport numpy as npimport matplotlib.pyplot as plt df = pd.read_csv("salaries.csv") x = df.iloc[:,:-1].values # get all rows with all columns except the last oney = df.iloc[:,-1].values # get all rows with only the last column plt.scatter(x, y)plt.show()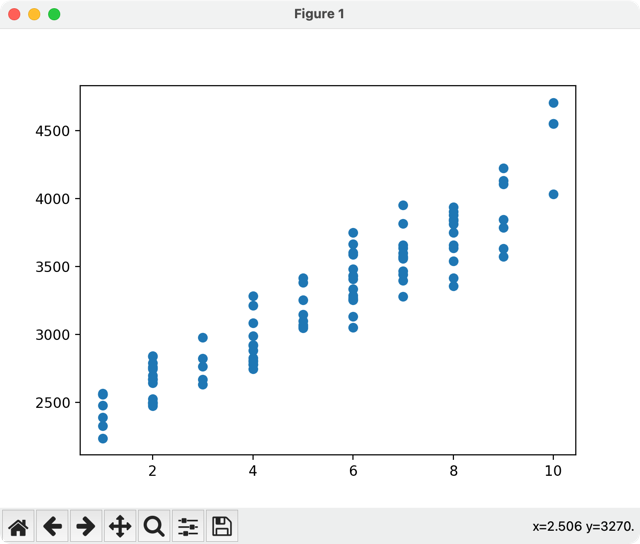
As you can see, there's a clear approximate linear dependency. We could draw an "invisible" straight line from the bottom-left to the top-right corner.
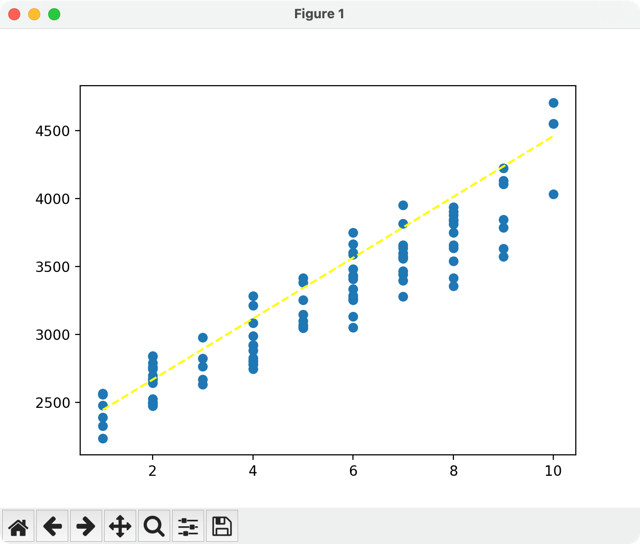
This lets us assume we can try to use a Linear Regression algorithm.
Mathematically, linear regression can be described as a formula:
Y = a + b * XSo the goal of ML model is to build a best-fitting straight line according to that formula. We will talk about mathematical explanation a bit more, in the later lesson. You can also read this general Wikipedia page about linear regression, but my goal is to focus on practical modeling with Python.
Next, we need to split our data from another angle: 80% of the data will be used for training the algorithm, and 20% will be used for testing if the algorithm is correct.
- Intro
- Example 1: More Simple
- Example 2: More Complex
Hello, Povilas! Thanks for a great course with great lessons! I've got a small problem - when using PyCharm instead of Jupyter notebooks, the plt.show() method actually doesn't work - it throws a warning "FigureCanvasAgg is non-interactive, and thus cannot be shown". Instead of this, I used plt.savefig() method to export the image in separate file. Maybe you can add it to the lesson materials :)
Thanks for the notice!
I've googled this error and it appears to be shown only in some cases on some operating systems. So I guess it's not worth adding to the lesson itself, but rather as your comment below it's enough.