Lesson 2: Read and Analyze Data
So, let's start writing a Python script for the demonstration of the Random Forest classification algorithm.
Plan of Actions
We need to have these steps in our Python script:
- Load the Python libraries
- Look at the data to see if we need any pre-processing/filtering
- Split the data "vertically" into X (called "features/input") and Y (called "target/output")
- Split the data "horizontally" into training data and testing data
- Train the model on training data
- Test the accuracy by trying to predict the testing data
- Evaluate model accuracy
Let's perform those steps one by one, with a bit deeper explanation.
Tools and Prerequisites
To run the Python script from this example, you will need the following:
- Python installed
- Installed Python libraries:
pandas,numpy, andscikit-learn - Install IDE to write code, but I will use Jupyter Notebook instead of IDE like PyCharm, see why
You will also need to have the fundamentals of Python knowledge, but in this case, this project will mostly be about importing libraries and calling their functions.
Load the Python Libraries
At the beginning of the script, we load these:
import pandas as pdimport numpy as npfrom sklearn.model_selection import train_test_splitfrom sklearn.ensemble import RandomForestClassifierfrom sklearn.metrics import accuracy_scoreUsually, in ML scripts, developers load pandas and numpy by default, and other libraries depend on the task itself.
In our case, the library scikit-learn contains all the functions we need:
- We're doing a so-called supervised learning, which means that we already have the data with values and will train the model on existing data with values already, so we need the
train_test_splitmethod. - Then, we're working on a classification problem, so we need the algorithm (
RandomForestClassifier) and the metrics to measure its accuracy (accuracy_score)
Notice: if you're not familiar with this syntax of imports in Python, you can read our tutorial Python Import Libraries: Three Syntax Versions.
Load Data and Look at it
Our initial data contains 100 tweets in a CSV file.
You can view/download that CSV here.
The pandas library will help us to quickly read that CSV file and look at its columns, showing the first five rows:
df = pd.read_csv("tweets.csv")df.head()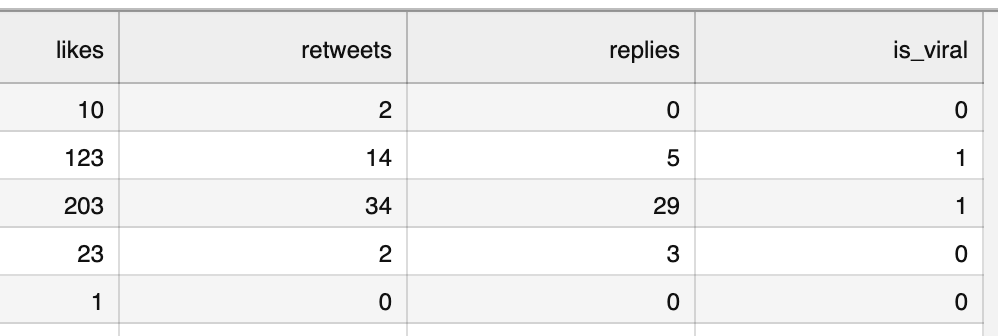
The letters df is a shortened word for "DataFrame", referring to a dataset in the pandas library.
You already saw that image above, so this is our initial structure.
To check the number of rows, we can call df.shape
df.shape # Result: (100, 4)# It means 100 rows and 4 columnsYou can see that I didn't write print(df.shape) here. That's because, in this course, I will use Jupyter Notebook to run the script cell by cell, so you won't see the print() functions in the script.
You can check out the Jupyter Notebook for this whole project here.
If you use an IDE like PyCharm, please add print(df.shape) to see the result. You can find out more in this tutorial: Jupyter Notebook vs PyCharm: Benefits for Data Science and ML Projects
Also, out of curiosity, let's look at how many tweets are defined as viral. For that, we use the value_counts() function from pandas on a specific column:
df['is_viral'].value_counts()# Result:is_viral0 741 26Name: count, dtype: int64So, 26% of the tweets are marked as successful, to be re-posted in the future.
Generally, at this point of ML projects, we need to check the data for empty values, filter something, or re-shape the non-ideal data.
But in this case, the data doesn't need any pre-processing: it doesn't have empty values or invalid columns. I took care of that upfront. So we can move on to building the model.
-
- 1. What is Classification and What is Our Task
- 2. Read and Analyze Data
- 3. Split Data and Train/Build the Model
- 4. Classification Example with Multiple Categories
- 5. Random Forest and Decision Trees: Algorithms Explained
- 6. Text Classification and Vectors: Auto-Assign Product Category
- 7. Text Classification: Bigger CSV File and Other Algorithms
No comments or questions yet...