Lesson 5: Random Forest and Decision Trees: Algorithms Explained
As promised, it's time to explain what that Random Forest algorithm does. I remind you it's only one of the possible algorithms for classification. We will discuss others in the future lessons.
To explain the Random Forest algorithm, I need first to explain the Decision Trees concept. Because, well, the forest consists of individual trees.
Decision Trees: Example 1 - Office VS Coffee Shop
In mathematics and algorithms, a tree represents a set of decisions with branches and sub-branches.
Here's an example from my own personal life decision. Every day, I wake up at different times, and if it's early enough (6-7 am), I start working from the coffee shop before going to the office.
I've been logging my mornings for a few weeks, and here's the CSV of my data:
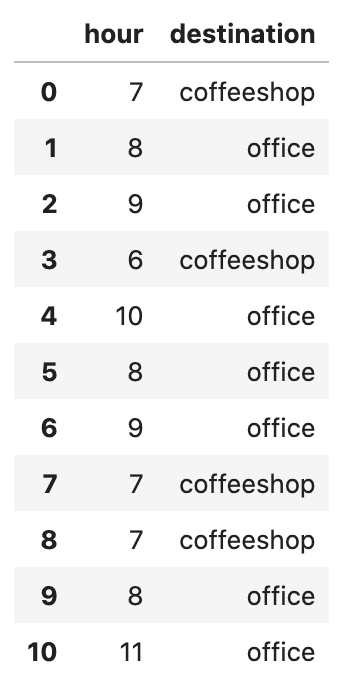
Based on that data, we can predict (classify) whether I will go to the coffee shop, judging by the time of the day.
Here's the graphical representation of such a tree:
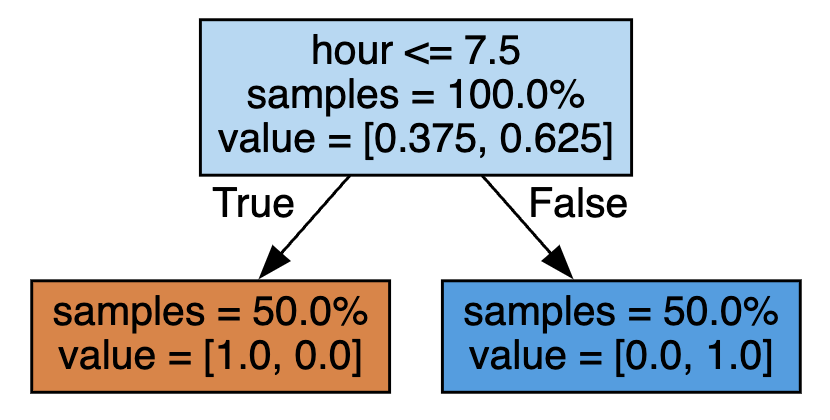
We have only two branches here, simple. It's like an if-else statement, right?
The value here shows the probability of each value (office vs coffee shop), so the branches go deeper until they reach the 1.0 probability.
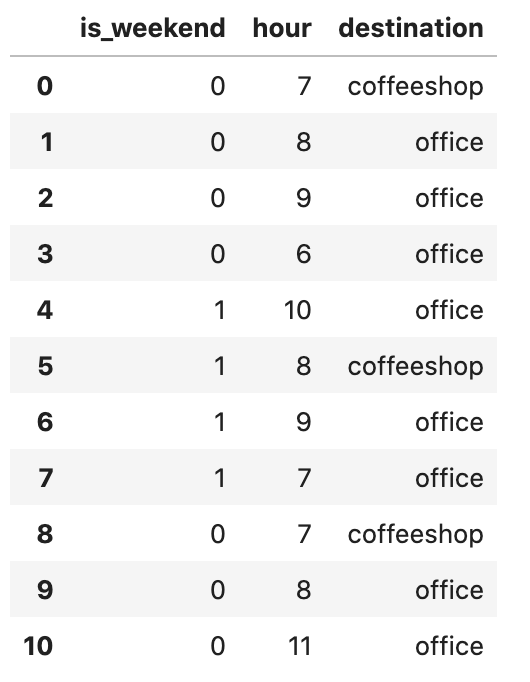
Now, what if we add a third value of "is it weekend or not"? I often work on weekends, but the coffee shop is open only at 8 am on Saturday/Sunday.
The updated CSV:
So, the prediction is a bit more complex, with more branches:
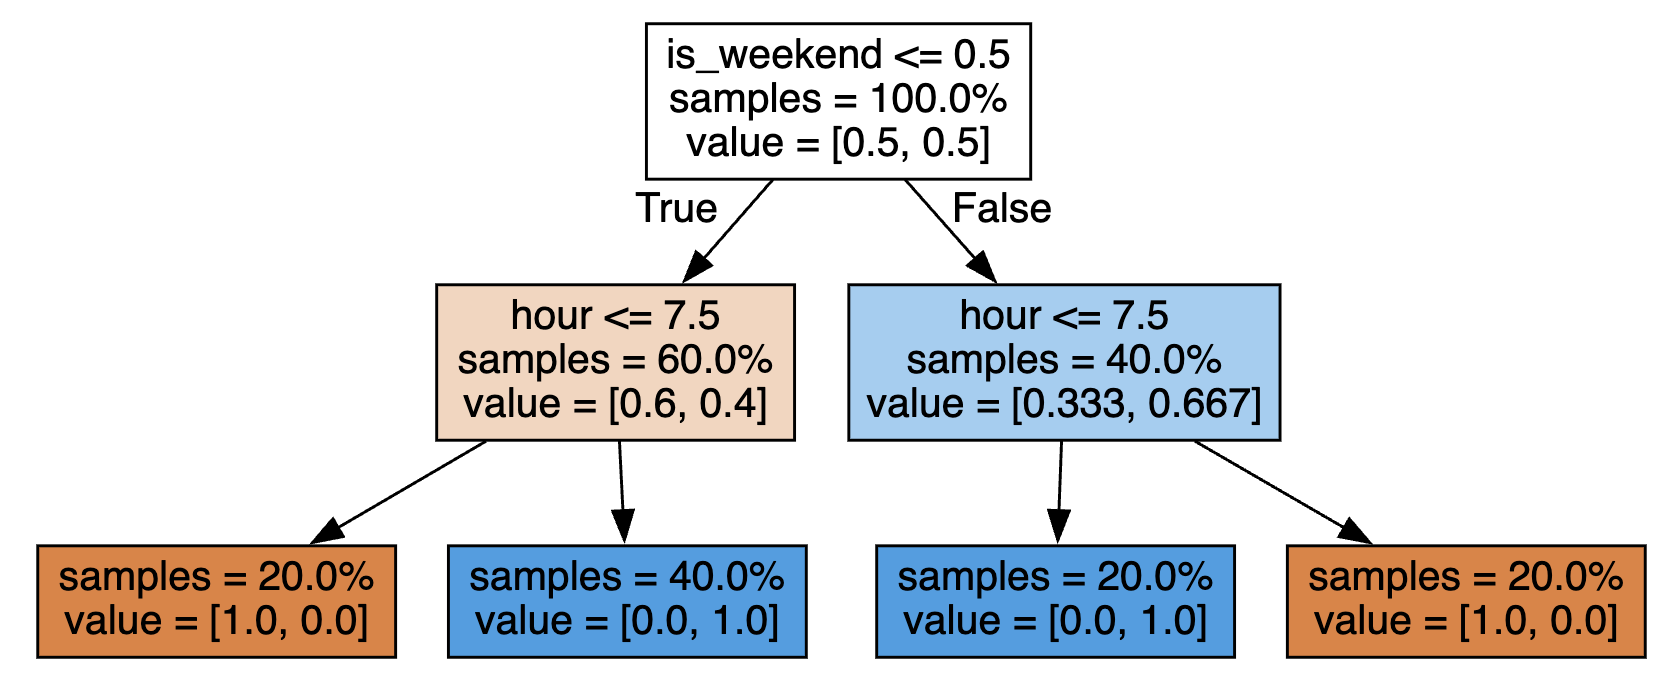
As you can see, the logic first checks if it's the weekend, and then each branch has another condition check for the hour. Again, the branches go deeper until one of the values reaches the 1.0 probability.
Notice: you can view/download that CSV here. Also, you can check out the Jupyter Notebook for this example, here.
Decision Trees: Example 2 - Viral Tweets
The example above is a very simple one. If we get a bit more realistic, the example from a previous lesson can help us.
Can we visualize the decision tree of the viral tweet example from the previous lesson? Here's how it would look:
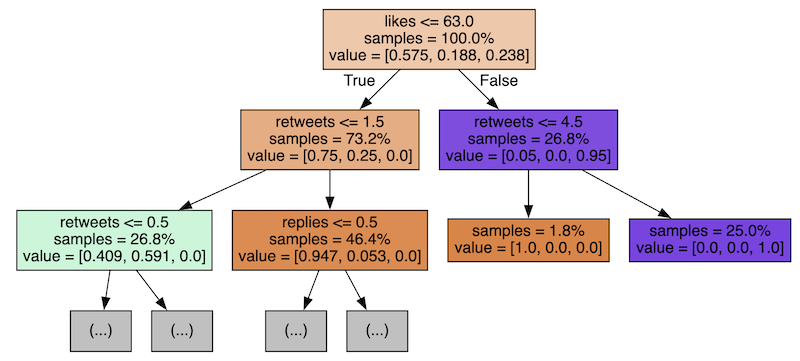
As you can see, first, we check if the tweet has 63+ likes (26.8% of the tweets, the right branch) or less (73.2% of tweets, the left branch).
The algorithm itself decides which number to pick for the branching: 63 likes, in this case.
The next step for the right branch is to check for more than 4.5 retweets (also auto-decided by the algorithm), building two more branches below.
These branches don't have any more sub-branches - they reached the 1.0 value of probability with these conclusions:
- Tweets with >63 likes and >4.5 retweets will be classified as viral
- Tweets with >63 likes but <4.5 retweets will be classified as NOT viral
You should get the idea: the algorithm is building these branches with deeper levels until we have the "winners" and no more branches left to build.
So, this is a Decision Tree.
But there are a few questions you should be raising:
- How to choose those numbers to compare with? Why 63 likes?
- And why do we check the likes first and not replies/retweets?
Here's where Random Forest comes in.
Random Forest of Decision Trees
The thing is that we cannot accurately predict what should be the starting branch of our tree: likes, retweets, or replies. And a computer can't do it either without analyzing all the possibilities and choosing the best one(s).
So this is precisely what the Random Forest algorithm is designed for: trying out a lot of possible decision trees with various branch combinations and picking the values from them.
In the script above, for visualizing the random forest, you see a loop of five so-called estimators, which are actually five different possible trees.
Here are just a few of them:
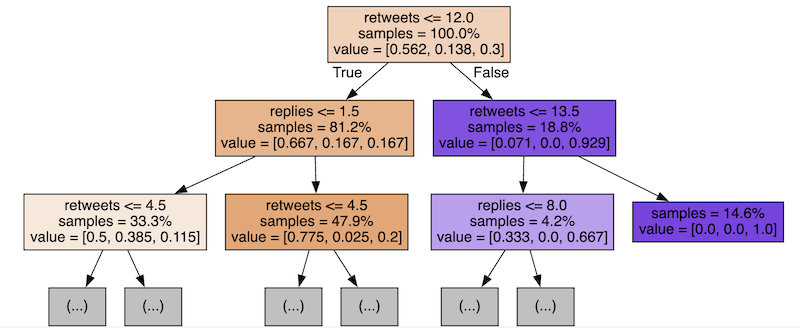
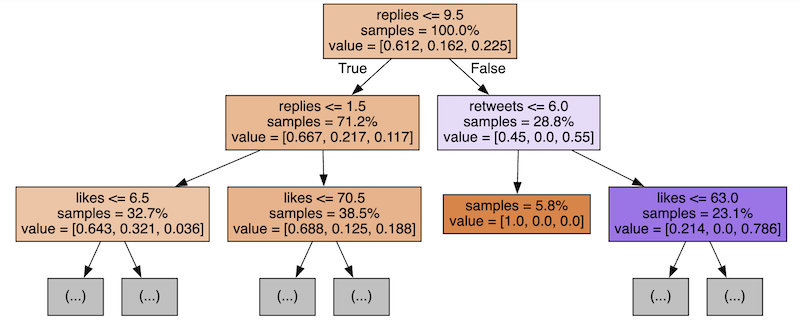
In reality, there are many more trees.
So, Random Forest aims to analyze those trees and later predict the values based on the combination of the trees.
When predicting the values, the algorithm may check hundreds or thousands of trees, choosing the value in each of them and returning the predicted value as "the most voted for", with each tree giving one vote.
Random Forest: Slow but Accurate
We will discuss other algorithms later, but generally, Random Forest is one of the slowest among classification algorithms because it needs to check many different datasets to get to the decisions.
But, at the same time, it is typically considered the most accurate one.
So, when picking the algorithm, you should likely choose Random Forest, where accuracy is more important than the speed of getting the results.
However, we can control the performance/accuracy ratio by providing various parameters to the model.
For example, we may provide the amount of estimators (trees) the algorithm would build.
clf = RandomForestClassifier(n_estimators=10)# The default value is 100When I made this change from 100 to 10 in the tweets project above, it lowered the accuracy from 95-100% to 85-90%.
That's logical: the fewer trees, the fewer votes for the correct value based on different features, and the more significant the inaccuracy.
Bonus: Visualization Script
If you're curious how to build such a tree visualisation from above, this is a Python script:
# we have `clf` and `df` variables from the scriptfrom sklearn.tree import export_graphvizimport graphviz # install this library with "pip3 install graphviz" for i in range(5): tree = clf.estimators_[i] dot_data = export_graphviz(tree, feature_names=df.iloc[:,:-1].columns, filled=True, max_depth=2, impurity=False, proportion=True) graph = graphviz.Source(dot_data) display(graph)-
- 1. What is Classification and What is Our Task
- 2. Read and Analyze Data
- 3. Split Data and Train/Build the Model
- 4. Classification Example with Multiple Categories
- 5. Random Forest and Decision Trees: Algorithms Explained
- 6. Text Classification and Vectors: Auto-Assign Product Category
- 7. Text Classification: Bigger CSV File and Other Algorithms
No comments or questions yet...