Pandas library is great for working with data from CSV files or other sources and quickly transforming it however you want. But before transformations, we need to get an overview of our dataset. In this tutorial, I will show you the most often-used functions to do exactly that.
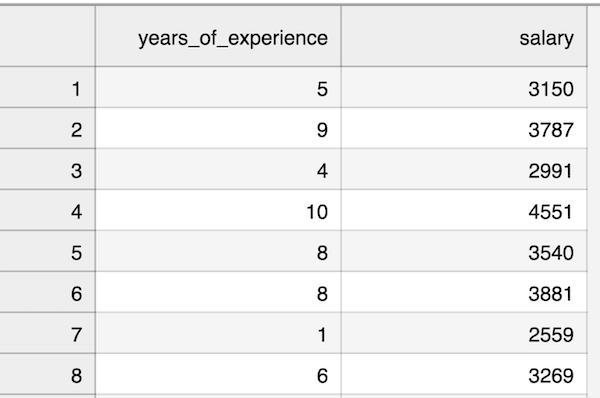
In this tutorial, we will work with a simple CSV file of salaries and years of experience with 100 rows of data.

So, first, we read the data into the DataFrame.
import pandas as pddf = pd.read_csv('salaries.csv')From here, you can view the information about that dataset from various angles.
1. df.shape
df.shape# Output: (100, 2)This gives the amount of rows and columns in the DataFrame.
Practical tip: it's a property, not a function, so there's no need for () at the end. It's shape, not shape(). Please don't ask me how I found out.
2. df.info()
df.info()# Output:<class 'pandas.core.frame.DataFrame'>RangeIndex: 100 entries, 0 to 99Data columns (total 2 columns): # Column Non-Null Count Dtype--- ------ -------------- ----- 0 years_of_experience 100 non-null int64 1 salary 100 non-null int64dtypes: int64(2)memory usage: 1.7 KBThis is a summary of columns, their types, non-null values, and the total memory usage of the DataFrame.
3. df.describe()
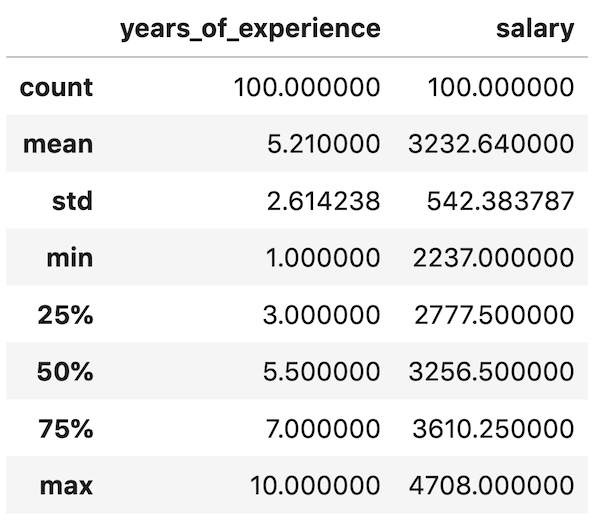
df.describe()
This function shows the min/max/average values of the columns. We have a separate article about that describe() function value meanings.
4. df.head()
df.head()
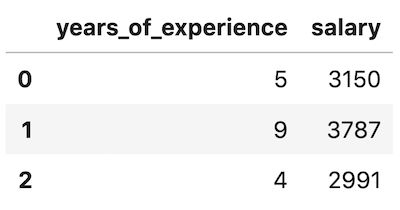
By default, it shows 5 first rows. But you can customize it to show any number of rows:
df.head(3)
5. df.tail()
df.tail()
This is the opposite of head(): it shows the last 5 rows, or however many rows you define as a parameter.
6. df.sample()
df.sample(5)
This is used if you want to get a random set of rows. You specify an optional parameter of row count. The default value is 1 row.
Remember that every time you run this function, you will get a different sample of data.
7. df.nlargest()
df.nlargest(5, 'salary')
This function will show the number of rows you specify with the biggest value of the column you specify.
There's also the opposite function called nsmallest().
8. df.column.value_counts()
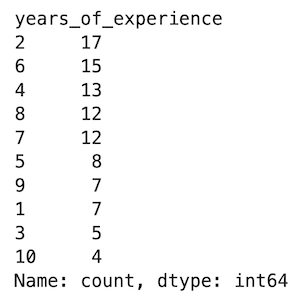
df.years_of_experience.value_counts()
You may be interested in how many rows are with each different value of a specific column.
This angle is more useful when working with classification tasks, like different categories of products.
An alternative syntax you may see elsewhere is having a column name as a parameter: df.value_counts('years_of_experience').
So, these are the most commonly used functions to get the overview information about the DataFrame. It helps to make decisions for data processing with filters and column transformations.
No comments or questions yet...