
Python pandas library has a great method df.describe() to show some numbers about the dataframe, but do you understand the meaning behind all of them?
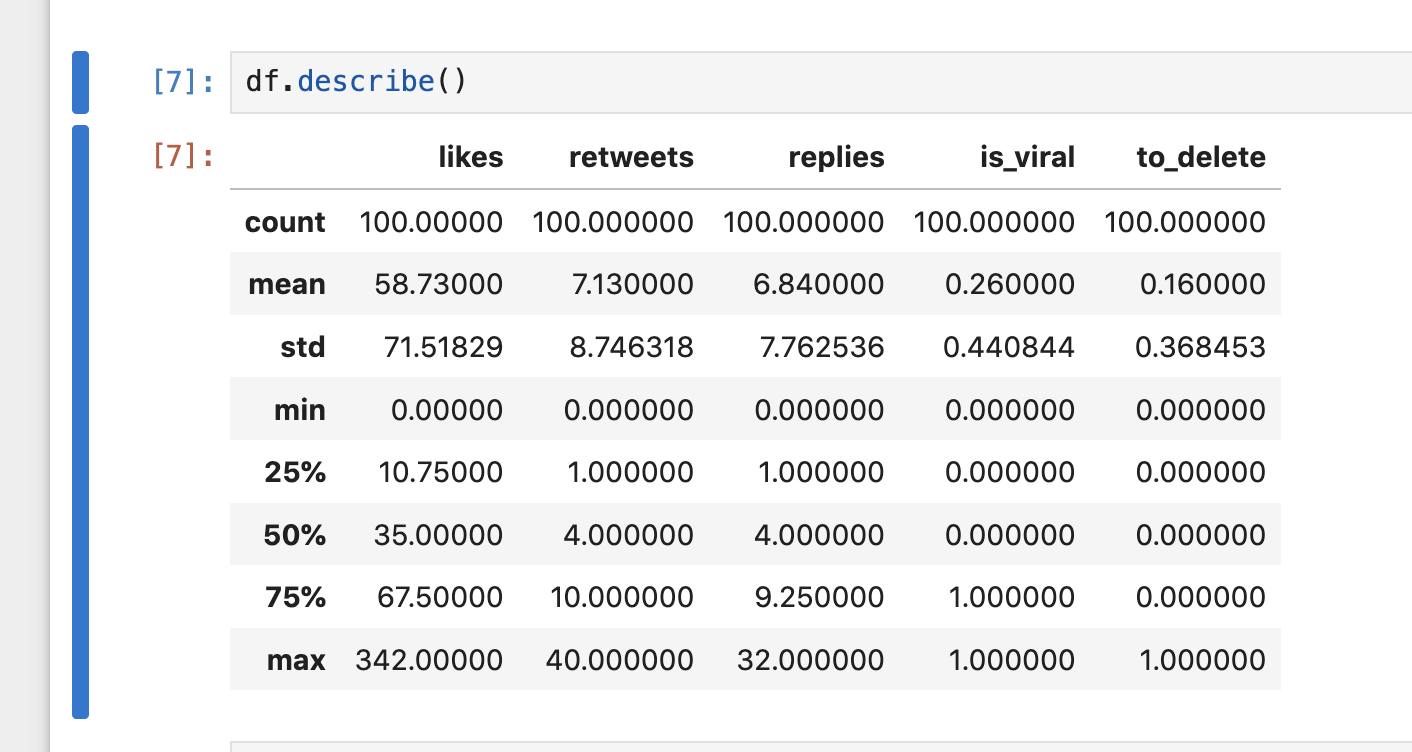
This tutorial will walk you through the df.describe() output values and explain their meaning.
Value 1 - Count
As simple as it might be, the first value we see is the count of the values in a column. For example, in our case, we see 100 everywhere because we have 100 rows, and they are all filled with data. As soon as there is a missing value, the count will be lower:
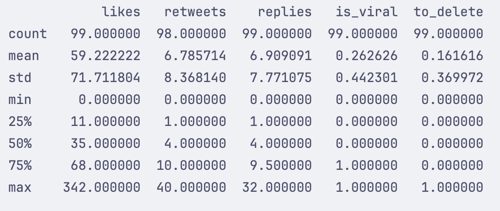
You can use this value to check for missing data values, as it will go lower than 100.
Value 2 - Mean
The mean value is the average of all the values in a column. For example, if we have a column with values 1, 2, 3, 4, 5, the mean value will be 3. If we add another value, 6, the mean value will be 3.5. This is calculated like this:
(1 + 2 + 3 + 4 + 5 + 6) / 6 = 3.5
In other words, this adds all the numbers and divides them by the number of values.
Value 3 - std
The standard deviation is a measure of how spread out the values are. For example, if we have a column with values 1, 2, 3, 4, 5, the standard deviation will be 1.414214. If we add another value, 6, the standard deviation will be 1.870829. This is calculated like this:
sqrt((1-3.5)^2 + (2-3.5)^2 + (3-3.5)^2 + (4-3.5)^2 + (5-3.5)^2 + (6-3.5)^2) / 6 = 1.870829
The formula for the standard deviation is:
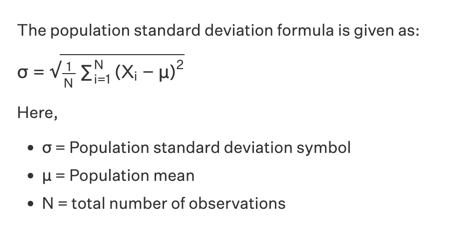
In other words, this shows you how much the values differ from the mean value. The higher the standard deviation, the more spread the values are, with more significant gaps between them.
Value 4 - Min
The minimum value is the smallest in a column. For example, if we have a column with values 1, 2, 3, 4, 5, the minimum value will be 1.
Values 5-7 - Percentiles
Percentiles are used to show how many values are below a specific value. For example, if we have 1, 2, 3, 4, 5, 50, this is how our percentiles will look like:
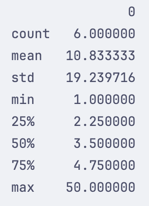
This means that:
- 25% of the values are below
2.25 - 50% of the values are below
3.5 - 75% of the values are below
4.75
The formula for calculating percentiles is:
25% percentile
-
1, 2 *|*, 3, 4, 5, 50- the*|*draws a line between the values - We then have
2 + (3 - 2) * 0.25which results in2.25
50% percentile
-
1, 2, 3 *|*, 4, 5, 50- the*|*draws a line between the values - We then have
3 + (4 - 3) * 0.5, which results in3.5
75% percentile
-
1, 2, 3, 4 *|*, 5, 50- the*|*draws a line between the values - We then have
4 + (5 - 4) * 0.75, which results in4.75
Note: We have chosen the most straightforward example and formula, but you can read more about percentiles here.
This gives you an idea of what the data looks like while doing your data mutation. It is also great to see what you can expect from your data when training a model.
Value 8 - Max
The maximum value is the biggest value in a column. For example, if we have a column with values 1, 2, 3, 4, 5, the maximum value will be 5.
No comments or questions yet...